See how a neighborhood voted, and who lives there.
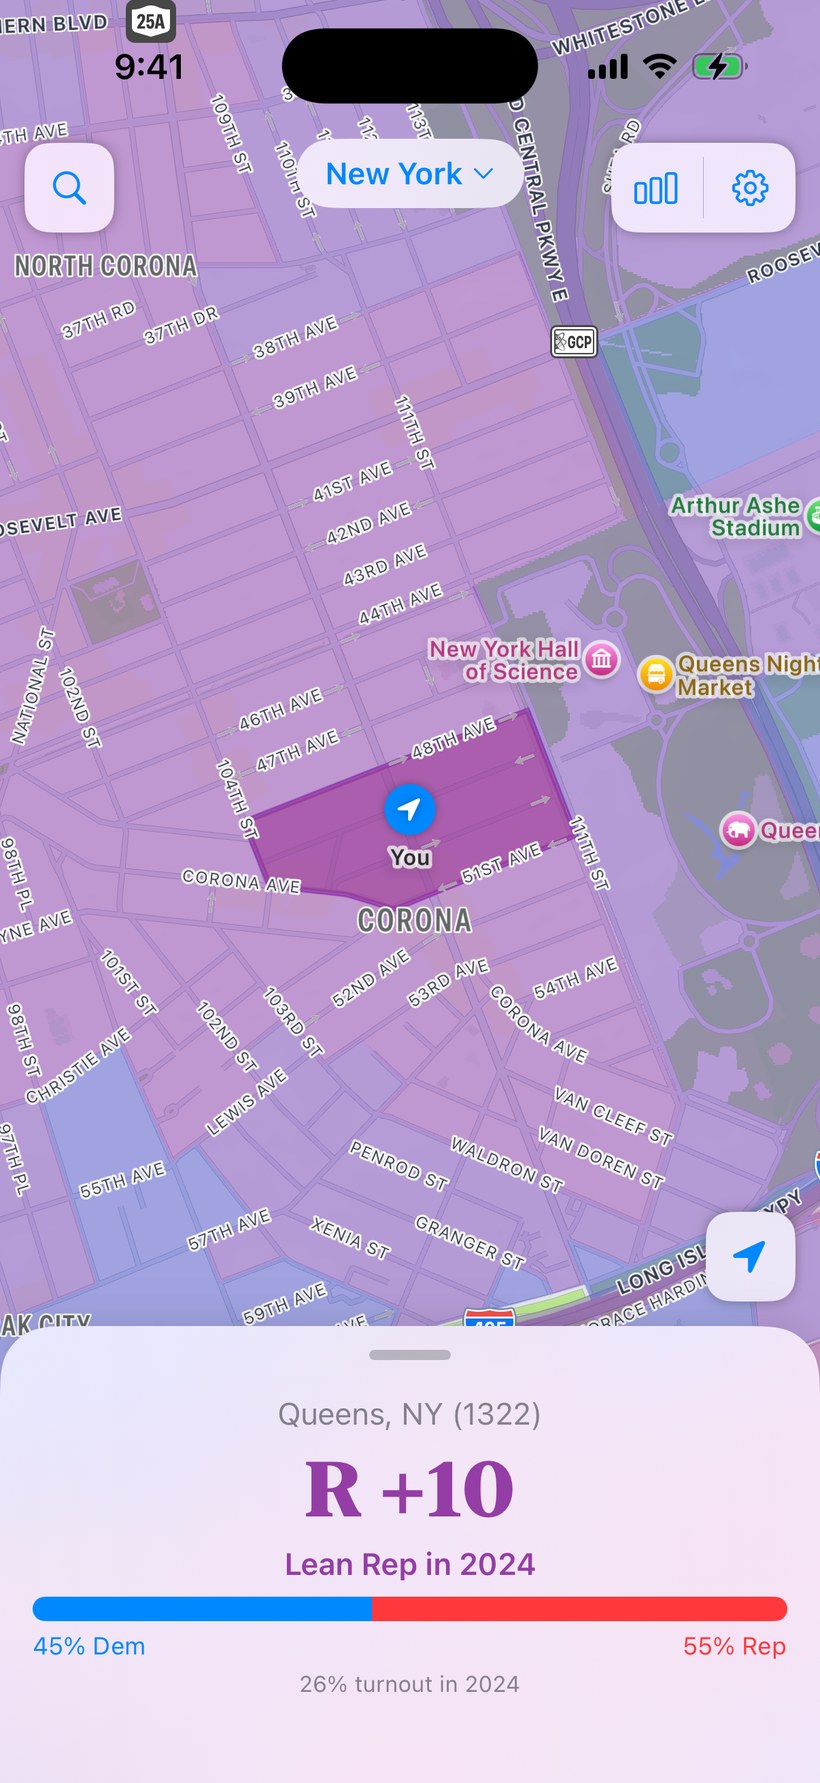
Find the precinct under your feet, or tap somewhere else on the map. Precinctly shows how that place voted, who lives there, and how it has changed.
Download Precinctly from the App Store.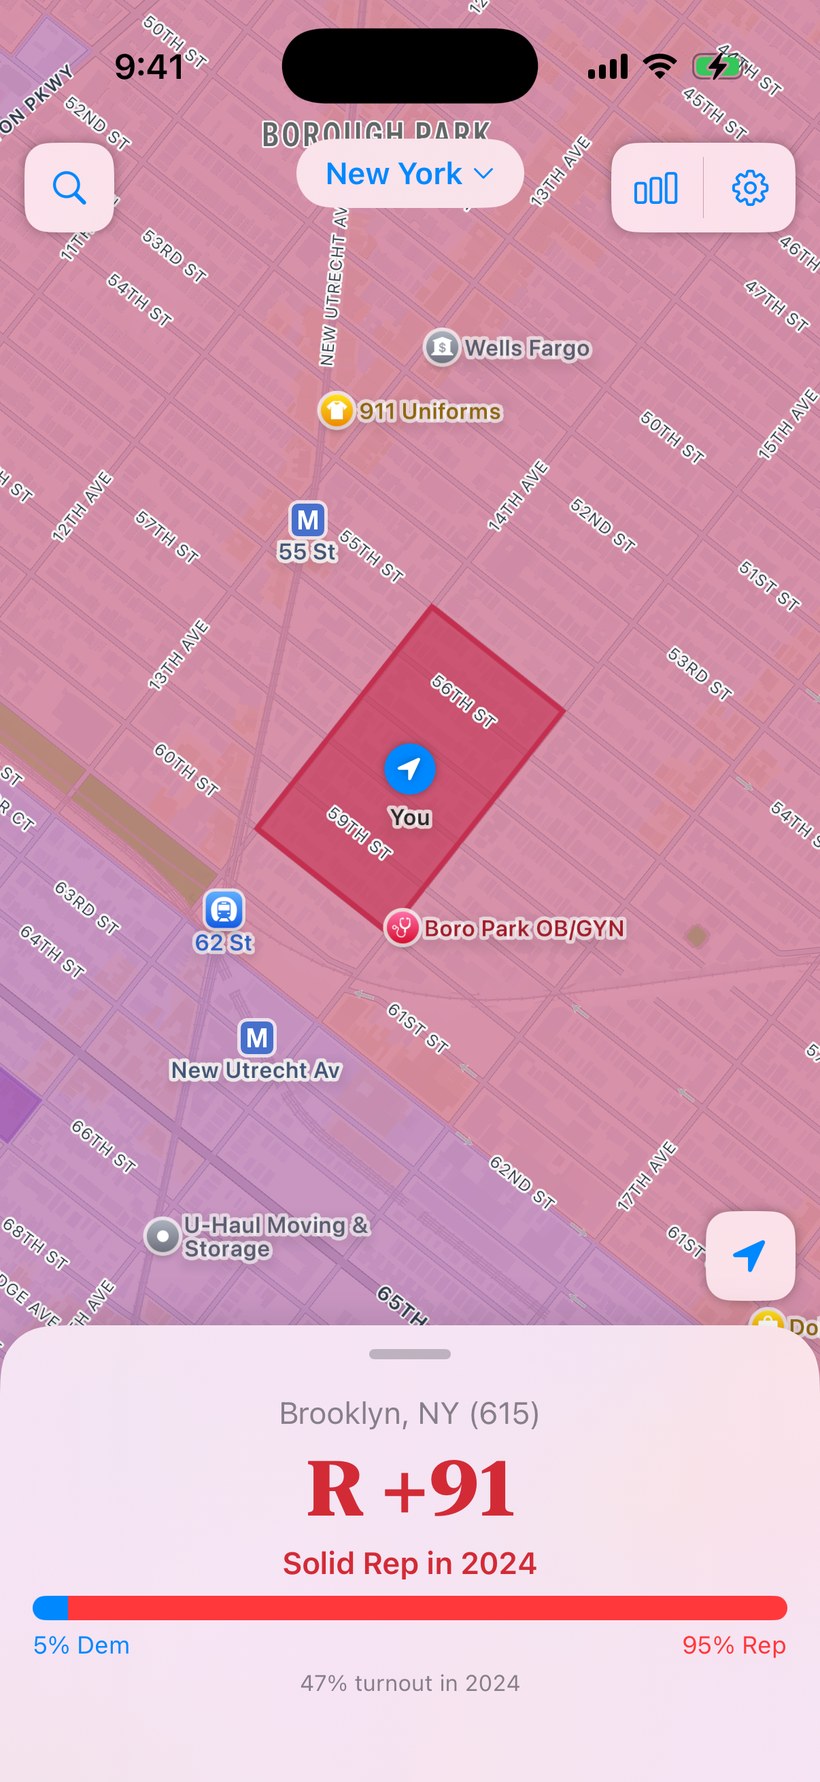
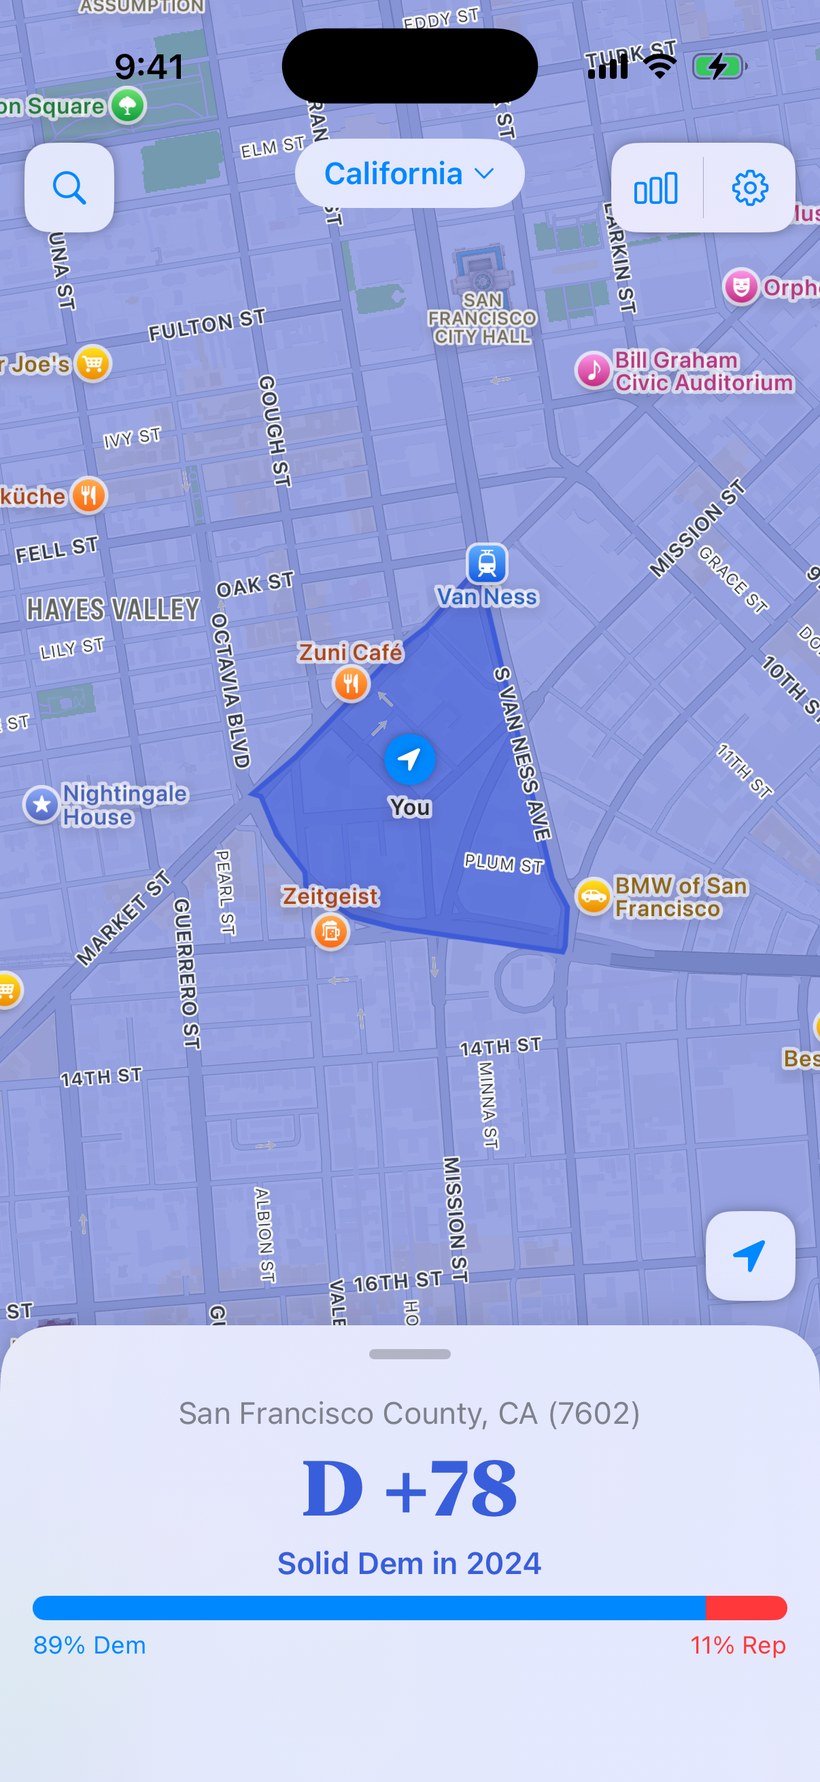
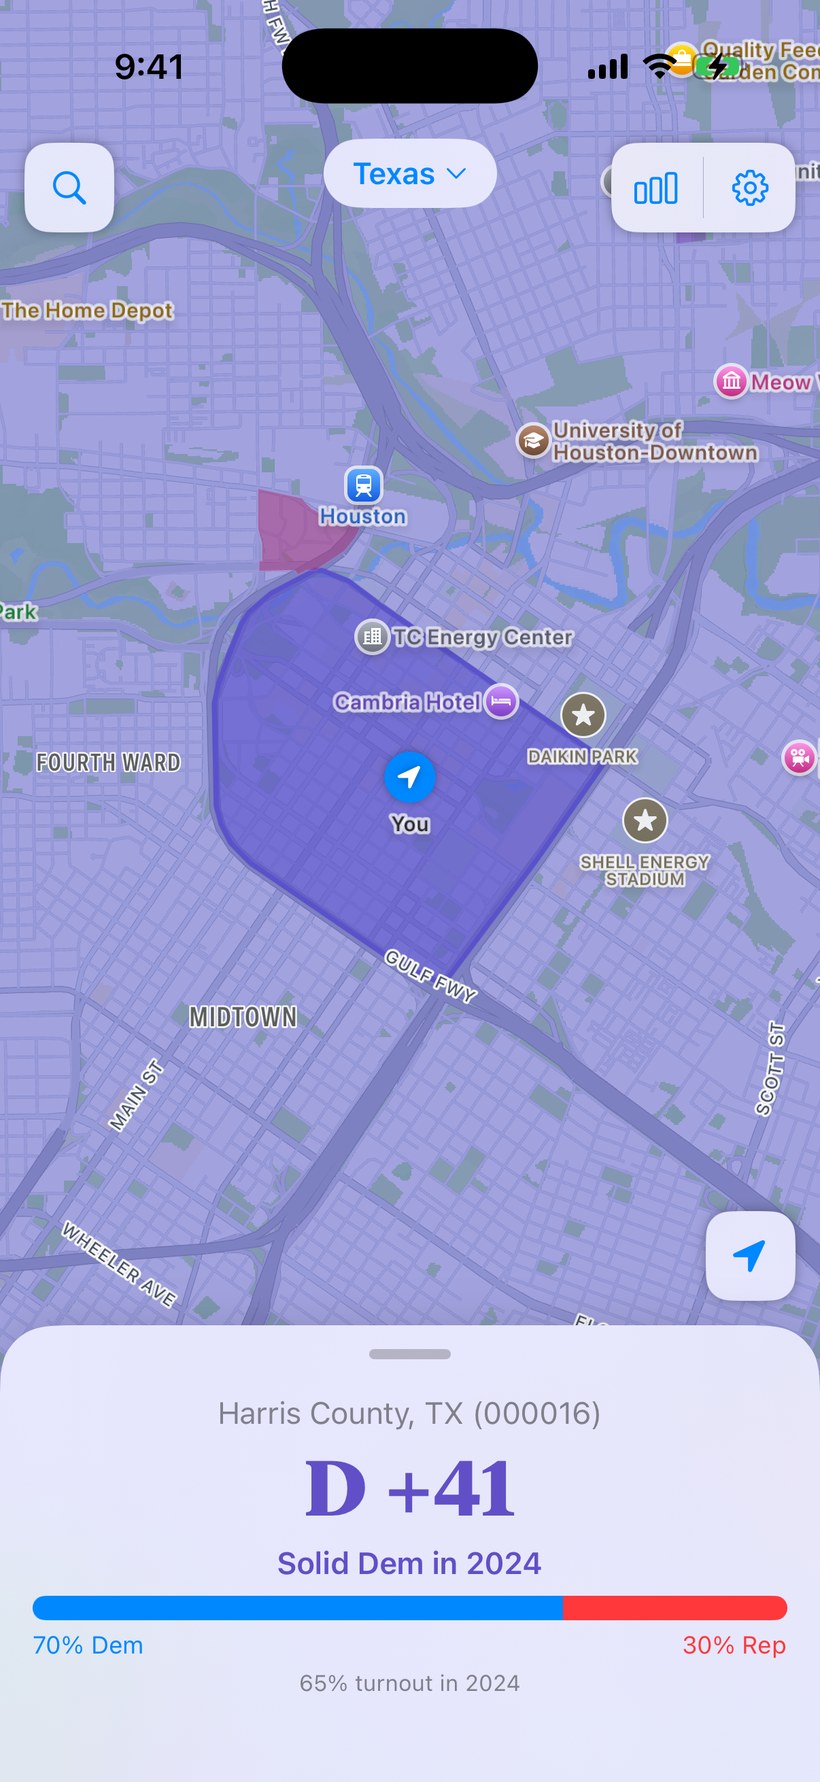
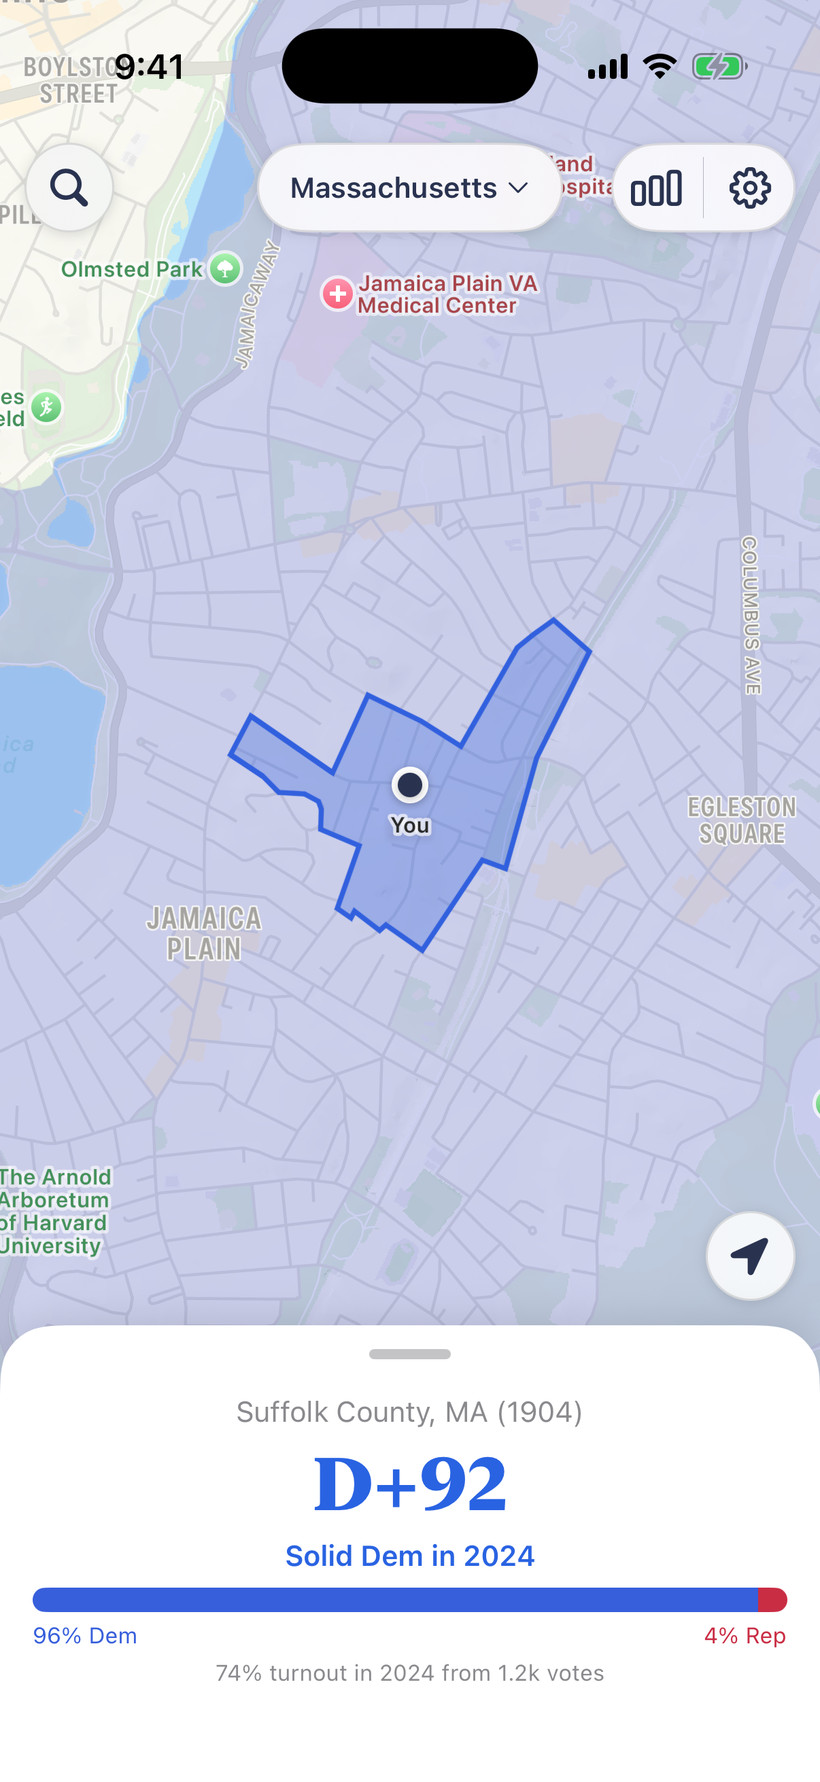
D+ leans Democratic, R+ Republican.
Tap a precinct to see its full profile.
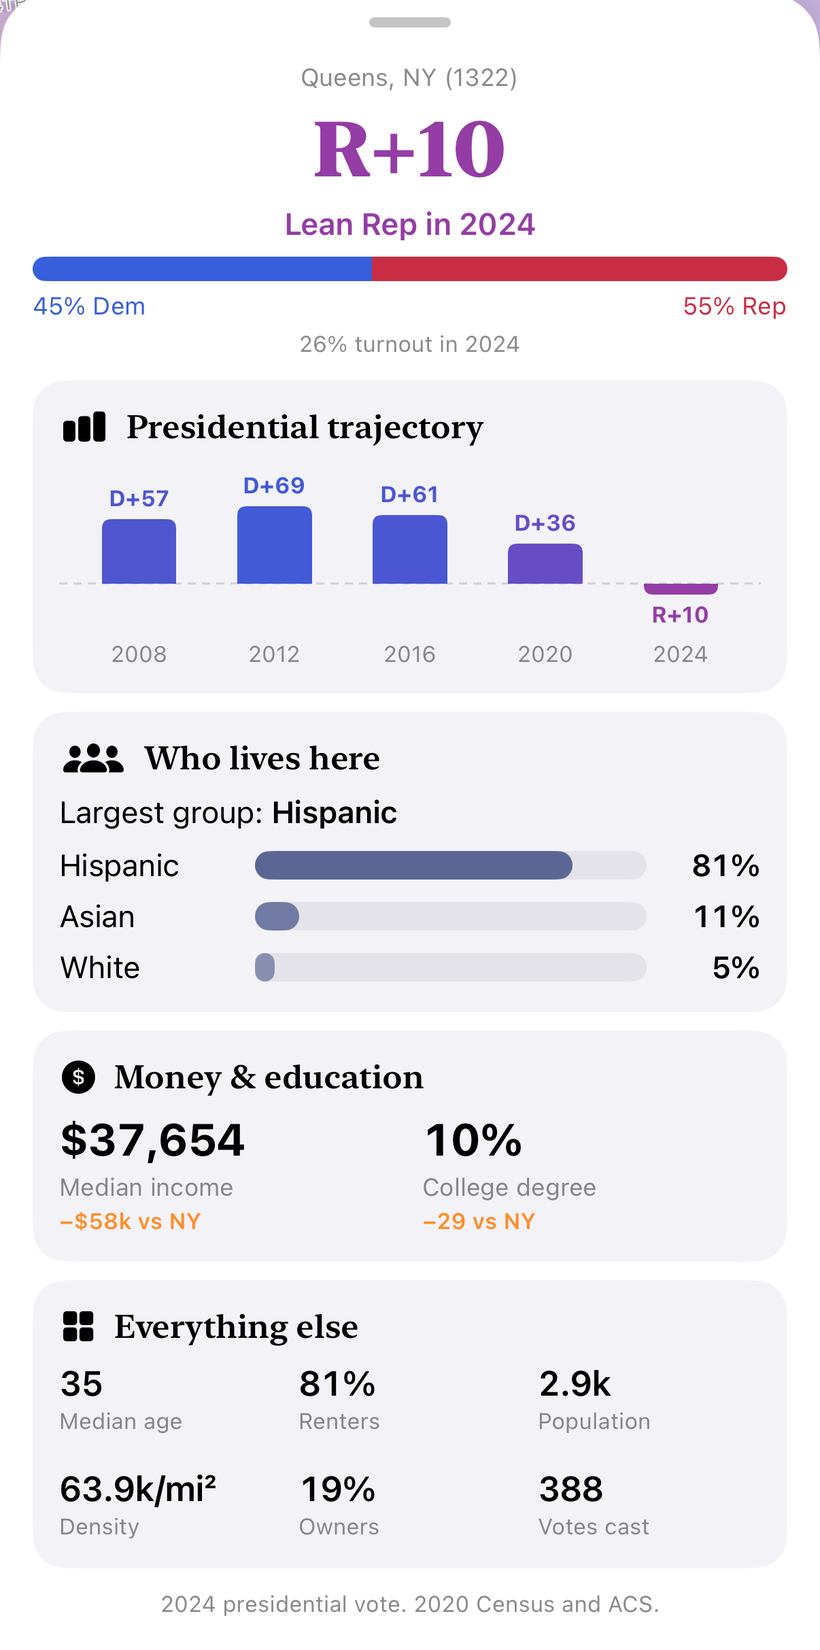
Corona, Queens. R+10 in 2024, D+61 in 2016.
- 1
The lean
How far it leaned, Democratic or Republican, in the last presidential race.
- 2
Which way it’s moving
The margin across recent elections. This precinct was D+61 in 2016 and R+10 by 2024, a 71-point swing in eight years.
- 3
Who lives here
Race, age, and households, from the Census and the American Community Survey.
- 4
Money & education
Median income and college degrees, set against the state.
See your precinct without opening the app.
It updates as you move. When your location changes, the widget redraws for the new precinct, with an hourly refresh as a backstop.
Compare precincts across a state.
Pull back from one precinct to see the average, the full spread, and the places that moved most.
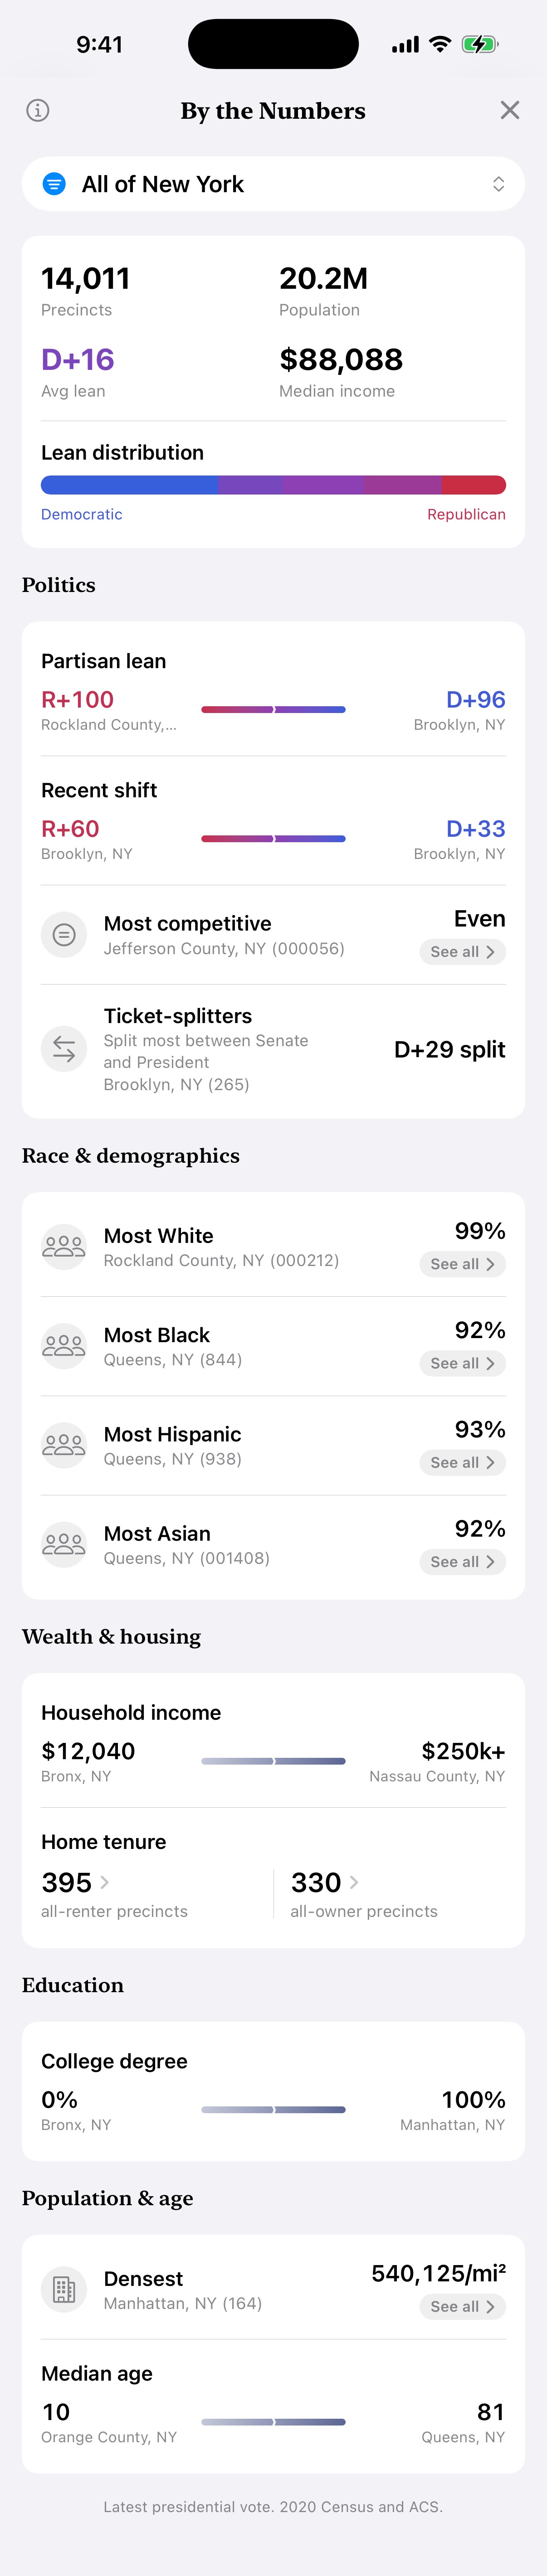
Four states. 48,945 precincts.
| State | Precincts | Counties |
|---|---|---|
| California | 23,910 | 58 |
| New York | 14,011 | 62 |
| Texas | 8,872 | 254 |
| Massachusetts | 2,152 | 14 |
The app combines government records with third-party election and redistricting datasets. Full source, attribution, and license notices are listed inside the app.
Use it the next time you are somewhere new.
Precinctly is built from public data and runs without an account, ads, or analytics. Your location stays on your device, and the source is open for anyone who wants to inspect how the map was made.